Introduction to Excel
E-7 Basic Graphing in MS Excel
Keyboarding (WPM) Growth Overview
Excel Final Assessment
Graphing your typing Progress for the Semester and interpreting the data.
OBJECTIVES:
Students will create a column graph of their Keyboard Speed to represent their progress over the course of the Semester.
Students will then analyze and interpret results of this investigation to determine if there has been growth in their typing ability/skill.
Students will create a column graph of their Keyboard Speed to represent their progress over the course of the Semester.
Students will then analyze and interpret results of this investigation to determine if there has been growth in their typing ability/skill.
Frameworks Associated with this Lesson:
Spreadsheets & Graphing in Excel
Standards Aligned with the BCTE Frameworks
Technology Literacy Knowledge and Skills (Grades 9 through 12)
6.A.01.08 Define and use functions of a spreadsheet application
6.A.01.09 Explain how various formatting options are used to convey information in charts or graphs.
In the Course Evaluation Survey
6.A.01.10 Identify the use of spreadsheet skills in various careers.
Part A:
Keyboarding Growth Assessment
Steps to complete this lesson:
- Download this file (Typing.com Scores Data Page) and save it to your Excel/CompApps Folder.
- Remember to Enable Editing.
- Do not change the file name.
- Open the file and Enable Editing, again if needed.
- Follow the Instruction Sheet, steps 1-31.
- You must open a NEW SHEET TAB to create the table and graph.
Starter Document:
aka Typing.com Scores Data Page:
| e7_wpm_keyboarding_growth_assessment_sy1819_sem2_v3.xlsx |
E7 Instructions Sheet:
| e7_instructions_basic_graphing_in_excel_final_assessment__v5.pdf |
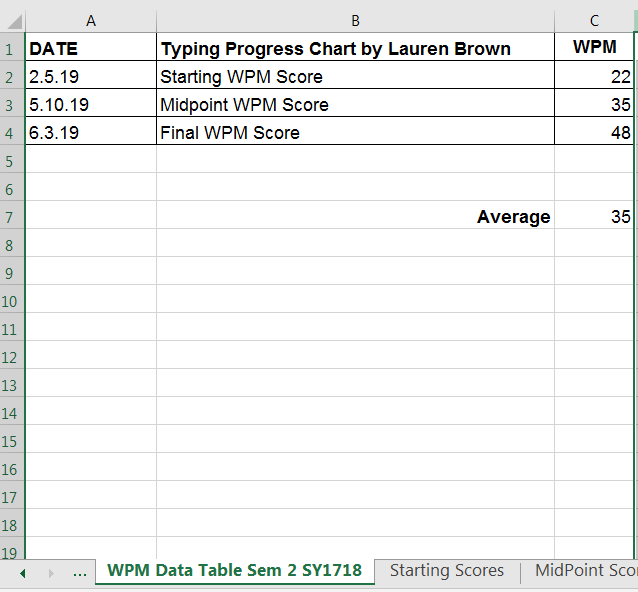
Exemplar:
Your finished table should resemble this example:
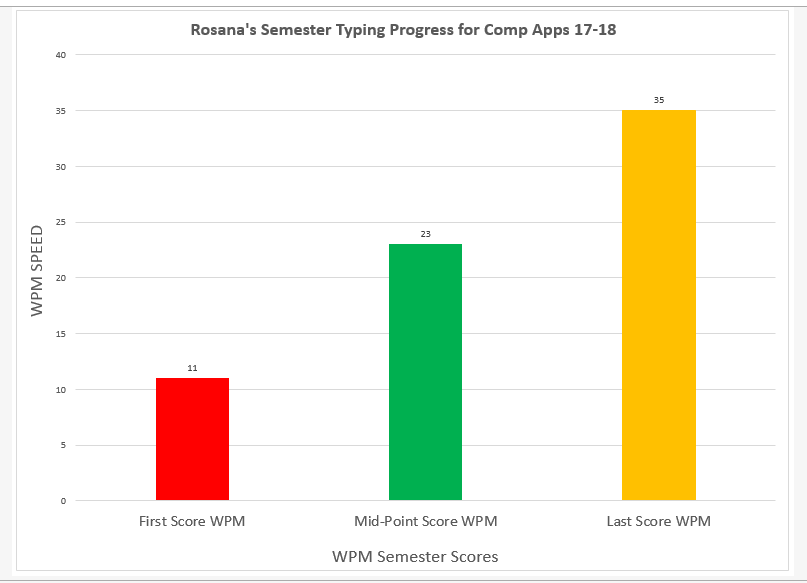
Exemplar:
Your finished Graph/Chart should
resemble this example:
Part B: Survey Time
SURVEY TIME
TIME TO COLLECT THE DATA
AS A CLASS!
Click the button to access the web-based survey. You will need the same three scores you used for the graph/chart you just created in Lesson E-7.
Remember this data is used for your teacher's
Formal Ed Evaluation report conducted by her boss.
Ms. Brown predicted that all students in Computer Apps who practice typing in each class session will improve their wpm score at or by the end of the semester, upon completing the course.
Enter your data to see if the teacher is correct!
Formal Ed Evaluation report conducted by her boss.
Ms. Brown predicted that all students in Computer Apps who practice typing in each class session will improve their wpm score at or by the end of the semester, upon completing the course.
Enter your data to see if the teacher is correct!

Skip this...
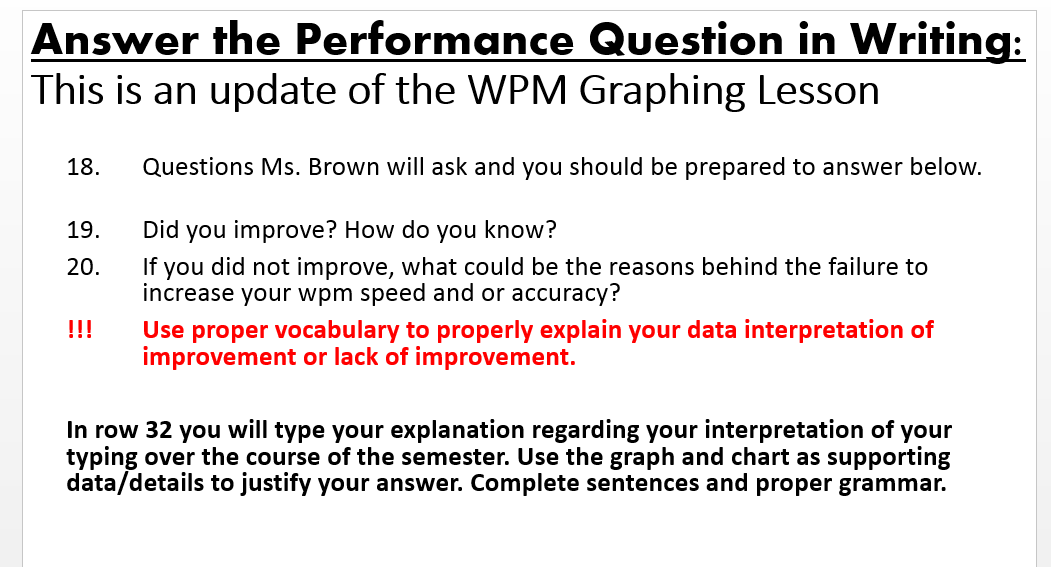
Performance Question